Java Servlet Container Example
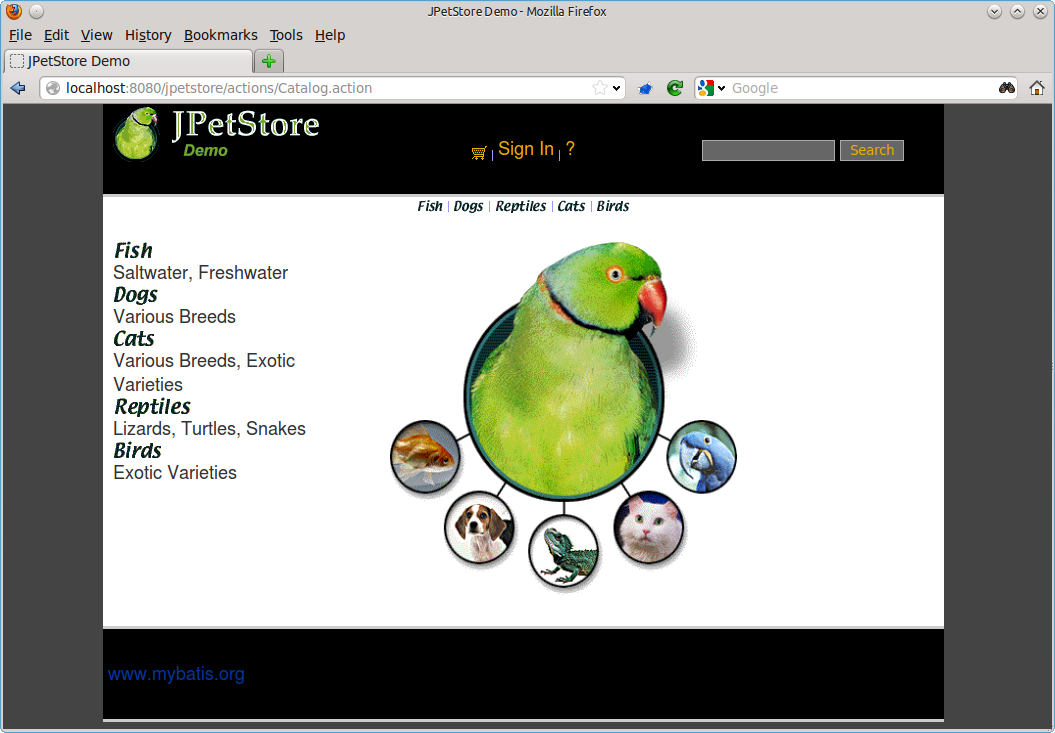
Using the sample Java web application MyBatis JPetStore <http://www.mybatis.org/spring/sample.html> this example demonstrates how to employ Kieker for monitoring a Java application running in a Java Servlet container – in this case Jetty <http://www.eclipse.org/jetty/>. Monitoring probes based on the Java Servlet API, Spring and AspectJ are used to monitor execution, trace, and session data (see also instrumenting-software-aspectj_).
Prerequisites
Download and extract the **Kieker** binary distribution <http://kieker-monitoring.net/download/>
The directory
kieker-1.14/examples/JavaEEServletContainerExamplecontains the prepared Jetty server with the MyBatis JPetStore application and the Kieker-based demo analysis application known from the Kieker Homepage <http://demo.kieker-monitoring.net/>.Switch to this directory or copy it to a suitable location.
Instrumenting Servlets
The subdirectory jetty includes the Jetty server with the JPetStore
application already deployed to the server’s webapps/ directory.
The example is prepared to use two alternative types of Kieker
probes: either the Kieker Spring interceptor (default) or the
Kieker AspectJ aspects. Both alternatives additionally use
Kieker’s Servlet filter.
Required Libraries and Kieker Monitoring Configuration
Both settings require the files aspectjweaver-1.8.2.jar and
kieker-1.14, which are already included in the webapps’s
WEB-INF/lib/ directory.
Also, a Kieker configuration file is already included in the Jetty’s
root directory, where it is considered for configuration by Kieker
Monitoring in both modes.
Servlet Filter (Default)
The file web.xml is located in the webapps’s WEB-INF/ directory.
Kieker’s Servlet filters are already enabled:
<filter>
  <filter-name>sessionAndTraceRegistrationFilter</filter-name>
  <filter-class>kieker.monitoring.probe.servlet.SessionAndTraceRegistrationFilter</filter-class>
  <init-param>
    <param-name>logFilterExecution</param-name>
    <param-value>true</param-value>
  </init-param>
</filter>
<filter-mapping>
  <filter-name>sessionAndTraceRegistrationFilter</filter-name>
  <url-pattern>/*</url-pattern>
</filter-mapping>
This filter can be used with both the Spring-based and the AspectJ-based instrumentation mode.
Spring-based Instrumentation (Default)
Kieker’s Spring interceptor are already enabled in the file
applicationContext.xml, located in the webapps’s WEB-INF/
directory:
<!-- Kieker's instrumentation probes based on the Spring AOP interception framework -->
<bean id="opEMII"
       class="kieker.monitoring.probe.spring.executions.OperationExecutionMethodInvocationInterceptor" />
<aop:config>
   <aop:advisor advice-ref="opEMII"
                  pointcut="execution(public * org.mybatis.jpetstore..*.*(..))"/>
</aop:config>
Note
When using, for example, the @Autowired feature in your Spring
beans, it can be necessary to force the usage of CGLIB proxy objects
with <aop:aspectj-autoproxy proxy-target-class="true"/>.
AspectJ-based Instrumentation
In order to use AspectJ-based instrumentation, the following changes
need to be performed. The file start.ini, located in Jetty’s root
directory, allows to pass various JVM arguments, JVM system properties,
and other options to the server on startup. When using AspectJ for
instrumentation, the respective JVM argument needs to be activated in
this file.
The AspectJ configuration file aop.xml is already located in the
webapps’s WEB-INF/classes/META-INF/ directory and configured to
instrument the JPetStore classes with Kieker’s OperationExecutionAspectFull
aspect.
When using the AspectJ-based instrumentation, make sure to disable the
Spring interceptor in the file applicationContext.xml, mentioned
above.
Start the Jetty server using the
start.jarfile (e.g., viajava -jar start.jar). You should make sure that the server started properly by taking a look at the console output that appears during server startup.Now, you can access the JPetStore application by opening the URL http://localhost:8080/jpetstore/. Kieker initialization messages should appear in the console output.

Browse through the application to generate some monitoring data.
In this example, Kieker is configured to write the monitoring data to JMX in order to communicate with the Kieker-based demo analysis application, which is accessible via <localhost:8080/livedemo/<.
In order to write the monitoring data to the file system, the JMX writer needs to be disabled in the file
kieker.monitoring.properties, which is located in the directorywebapps/jpetstore/WEB-INF/classes/META-INF/. After a restart of the Jetty server, the Kieker startup output includes the information where the monitoring data is written to (should be akieker-<DATE-TIME>/directory) located in the default temporary directory. This data can be analyzed and visualized using kieker-tools-trace-analysis-tool_.