Using Kieker Trace-Analysis
Kieker comes with a wide range of analysis stages which can be used to analyze monitoring data. There is extensive documentation on how to build tools with Kieker analysis in developing-with-kieker-writing-tools-and-services. For this Getting Started chapter, we want to focus on using existing tooling, specifically the trace-analysis tool.
Monitoring data collected by the previous steps contains trace
information based on OperationExecutionRecords that can be
analyzed and visualized with the Kieker trace-analysis tool which
is included in the Kieker binary distribution. The tool outputs dot
and pict files.
In order to use this tool, it is necessary to install two third-party pro-grams:
Note
GraphViz A graph visualization software which can be down-loaded from
http://www.graphviz.orgGNU PlotUtils A set of tools for generating 2D plotgraphics which can be downloaded from
http://www.gnu.org/software/plotutils/(for Linux) and fromhttp://gnuwin32.sourceforge.net/packages/plotutils.htm(for Windows).ps2pdf The
ps2pdftool is used to convert ps files to pdf files.
Under Windows it is recommended to add the bin/ directories of
both tools to the “path” environment variable. It is also possible that
the GNU PlotUtils are unable to process sequence diagrams. In this case
it is recommended to use the Cygwin port of PlotUtils.
Once both programs have been installed, the Kieker
trace-analysis tool can be used. It can be found in the tools
directory of the Kieker binary release. Unpack the
trace-analysis-1.14.zip alongside the jpetstore-6 directory.
Start scripts can then be found in
trace-analysis-1.14/bin/trace-analysis (Unix) and
trace-analysis-1.14/bin/trace-analysis.bat (Windows).
Non-parameterized calls of the scripts print all possible options on the
screen.The commands shown in Listings below generate a sequence diagram
as well as a call tree to an existing directory named out/. The
monitoring data is assumed to be located in the logging directory, e.g.,
kieker-20200615-130444-341575577055999-UTC--KIEKER/ alongside the
jpetstore-6 directory.
Before executing the trace-analysis, you need to create the out/
directory alongside the jpetstore-6 directory.
Unix version
trace-analysis-1.14/bin/trace-analysis -inputdirs
trace-analysis-1.14/bin/trace-analysis \
   -inputdirs kieker-20200615-130444-341575577055999-UTC--KIEKER \
   -outputdirout/ \
   -plot-Deployment-Sequence-Diagrams–plot-Call-Trees–short-labels
Windows version
trace-analysis-1.14/bin/trace-analysis.bat
  -inputdirs kieker-20200615-130444-341575577055999-UTC--KIEKER
  -outputdir out\
  -plot-Deployment-Sequence-Diagrams–plot-Call-Trees–short-labels
The resulting contents of the out/ directory should be similar to
the following tree:
out/deploymentSequenceDiagram-6120391893596504065.pic-callTree-6120391893596504065.dot-system-entities.html
The .pic and .dot files can be converted into other formats,
such as .pdf, by using the GraphViz and Plot Utils
tools dot and pic2plot. Type the following to generate PDF
file from the graphics.
dot callTree−6120391893596504065.dot -T pdf -o callTree.pdf
pic2plot deploymentSequenceDiagram−6120391893596504065.pic-T pdf > sequenceDiagram.pdf
Note
The scripts dotPic-fileConverter.sh and dotPic-fileConverter.bat
convert all .pic and .dot in a specified directory. The scripts
can be found in the bin directory of the Kieker binary distribution.
Example Kieker Trace-Analysis Outputs
The examples presented in this section were generated based on the
monitoring data which can be found in the
directory examples/userguide/ch5-trace-monitoring-aspectj/testdata/kieker-20100830-082225522-UTC/.
It consists of 1635 traces of the Bookstore application with
AspectJ-based instrumentation, as described in the gt-aspectj-instrumentation-example.
In order to illustrate the visualization of distributed traces, the
hostname of the Catalog’s method getBook was probabilistically
changed to a second hostname. The output can be found in the
directory examples/userguide/ch5-trace-monitoring-aspectj/testdata/kieker-20100830-082225522-UTC-example-plots/.
Todo
Fix reference to example.
Textual Trace and Equivalence Class Representations
Execution Traces
Textual execution trace representations of valid/invalid traces are
written to an output file using the command-line options
--print-Execution-Tracesand --print-invalid-Execution-Traces.
The following listing shows the execution trace representation for the
valid trace … 6129.
TraceId 6488138950668976129 (minTin=1283156498770302094 (Mon, 30 Aug
2010 08:21:38.770 +0000 (UTC));

maxTout=1283156498820012272 (Mon, 30 Aug 2010 08:21:38.820 +0000 (UTC));
maxEss=2):

<6488138950668976129[0,0] 1283156498770302094−1283156498820012272
SRV0::@3:bookstoreTracing.Bookstore.searchBook N/A>

<6488138950668976129[1,1] 1283156498770900902−1283156498773404399
SRV1::@1:bookstoreTracing.Catalog.getBook N/A>

<6488138950668976129[2,1] 1283156498817823953−1283156498820007367
SRV0::@2:bookstoreTracing.CRM.getOffers N/A>

<6488138950668976129[3,2] 1283156498817855493−1283156498819999771
SRV1::@1:bookstoreTracing.Catalog.getBook N/A
Message Traces
Textual message trace representations of valid traces are written to an
output file using the command-line option --print-Message-Traces.
The listing below shows the message trace representation for the valid
trace … 6129.
Trace 6488138950668976129:
<SYNC−CALL 1283156498770302094
’Entry’−−>6488138950668976129[0,0]1283156498770302094−1283156498820012272
SRV0::@3:bookstoreTracing.Bookstore.searchBook N/A>

<SYNC−CALL 1283156498770900902 6488138950668976129[0,0]
1283156498770302094−1283156498820012272SRV0::@3:bookstoreTracing.Bookstore.searchBook
N/A−−>6488138950668976129[1,1]1283156498770900902−1283156498773404399
SRV1::@1:bookstoreTracing.Catalog.getBook N/A>

<SYNC−RPLY 1283156498773404399 6488138950668976129[1,1]
1283156498770900902−1283156498773404399SRV1::@1:bookstoreTracing.Catalog.getBook
N/A−−>6488138950668976129[0,0]1283156498770302094−1283156498820012272
SRV0::@3:bookstoreTracing.Bookstore.searchBook N/A>

<SYNC−CALL 1283156498817823953 6488138950668976129[0,0]
1283156498770302094−1283156498820012272SRV0::@3:bookstoreTracing.Bookstore.searchBook
N/A−−>6488138950668976129[2,1]1283156498817823953−1283156498820007367
SRV0::@2:bookstoreTracing.CRM.getOffers N/A>

<SYNC−CALL 1283156498817855493 6488138950668976129[2,1]
1283156498817823953−1283156498820007367SRV0::@2:bookstoreTracing.CRM.getOffers
N/A−−>6488138950668976129[3,2]1283156498817855493−1283156498819999771
SRV1::@1:bookstoreTracing.Catalog.getBook N/A>

<SYNC−RPLY 1283156498819999771 6488138950668976129[3,2]
1283156498817855493−1283156498819999771SRV1::@1:bookstoreTracing.Catalog.getBook
N/A−−>6488138950668976129[2,1]1283156498817823953−1283156498820007367
SRV0::@2:bookstoreTracing.CRM.getOffers N/A>

<SYNC−RPLY 1283156498820007367 6488138950668976129[2,1]
1283156498817823953−1283156498820007367SRV0::@2:bookstoreTracing.CRM.getOffers
N/A−−>6488138950668976129[0,0]1283156498770302094−1283156498820012272
SRV0::@3:bookstoreTracing.Bookstore.searchBook N/A>

<SYNC−RPLY 1283156498820012272 6488138950668976129[0,0]
1283156498770302094−1283156498820012272SRV0::@3:bookstoreTracing.Bookstore.searchBook
N/A−−>’Entry’>
Trace Equivalence Classes
Deployment/assembly-level trace equivalence classes are computed and
written to output files using the command-line options
--print-Deployment-Equivalence-Classes and
--print-Assembly-Equivalence-Classes. The following listings show
the output generated for the monitoring data used in this section for
deployment and assembly, respectively.
Deployment
Class 0 ; cardinality : 386; # executions: 4; representative :
6488138950668976130; max. stack depth: 2
Class 1 ; cardinality : 706; # executions: 4; representative :
6488138950668976129; max. stack depth: 2
Class 2 ; cardinality : 187; # executions: 4; representative :
6488138950668976141; max. stack depth: 2
Class 3 ; cardinality : 356; # executions: 4; representative :
6488138950668976131; max. stack depth: 2
Assembly
Class 0 ; cardinality : 1635; # executions: 4; representative :
6488138950668976129; max. stack depth: 2
Sequence Diagrams
Deployment-Level Sequence Diagrams
Deployment-level sequence diagrams are generated using the command-line
option --plot-Deployment-Sequence-Diagrams. The following image
show these sequence diagrams for each deployment-level trace equivalence
representative (6129, 6130, 6131, 6141).

Trace 6129

Trace 6130

Trace 6131

Trace 6141
Assembly-Level Sequence Diagrams
Assembly-level sequence diagrams are generated using the command-line
option --plot-Assembly-Sequence-Diagrams. The following figure shows
the sequence diagram for the assembly-level trace equivalence
representative.

Trace 6129
Call Trees
Trace Call Trees
Trace call trees are generated using the command-line option
--plot-Call-Trees. The following figures show call trees for each
deployment-level trace equivalence representative.

Call Trees
Aggregated Call Trees
Aggregated deployment/assembly-level call trees are generated using the
command-line options --plot-Aggregated-Deployment-Call-Treeand
--plot-Aggregated-Assembly-Call-Tree. The following figures show
these aggregated call trees for the traces contained in the monitoring
data used in this section. The deployment call tree is on the left and
the right is the assembly call tree.

Aggregated Assembly Call Tree

Aggregated Assembly Call Tree
Dependency Graphs
Container Dependency Graphs
A container dependency graph is generated using the command-line option
--plot-Container-Dependency-Graph. The next figure shows the
container dependency graph for the monitoring data used in this section.

Container Dependency Graph
Component Dependency Graphs
Deployment/assembly-level component dependency graphs are generated
using the command-line options
--plot-Deployment-Component-Dependency-Graphand
--plot-Assembly-Component-Dependency-Graph.

Deployment Component Dependency Graph

Assembly Component Dependency Graph
Operation Dependency Graphs
Deployment/assembly-level operation dependency graphs are generated
using the command-line options
--plot-Deployment-Operation-Dependency-Graph and
--plot-Assembly-Operation-Dependency-Graph.

Deployment Operation Dependency Graph

Assembly Operation Dependency Graph
Response Times in Dependency Graphs
The afore-mentioned dependency graphs can also be decorated by the
response times,adding the minimum, the average, and the maximum response
times of the components.The decoration will be generated with one of the
additional responseTimes commandline parameters behind the
corresponding plot- command.

Response Time - Assembly Component Dependency Graph
HTML Output of the System Model
The Kieker trace-analysis writes an HTML representation of the
system model reconstructed from the trace data to a
filesystem-entities.html. The following screenshot depicts the
output rendered by a web browser.
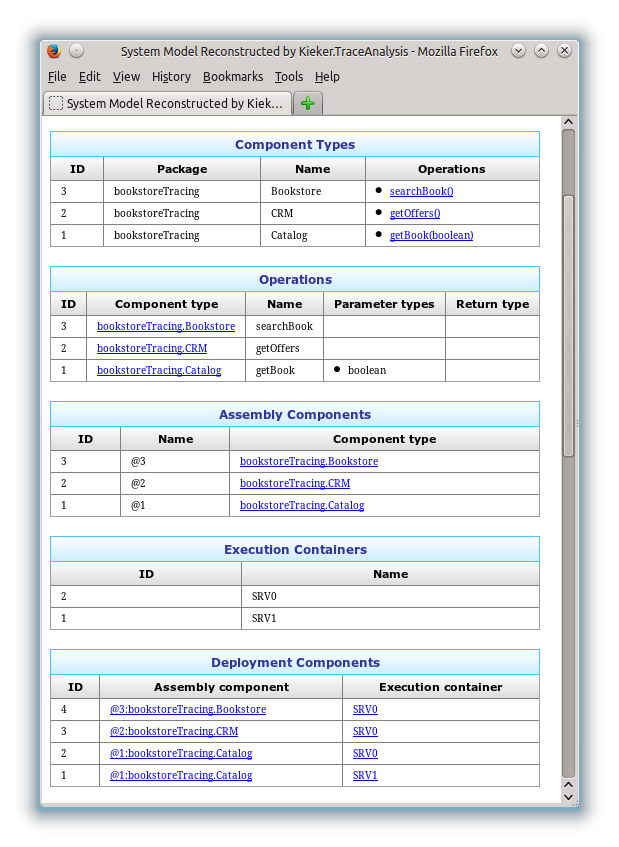
System Model Output