How to perform Trace Analysis
Todo
Fix internal references.
Kieker trace-analysis implements the special feature of Kieker allowing to monitor, analyze, and visualize (distributed) traces of method executions and corresponding timing information. For this purpose, it includes monitoring probes employing AspectJ, Java Servlet, Spring, and Apache CXF technology. Moreover, it allows to reconstruct and visualize architectural models of the monitored systems, e.g., as sequence and dependency diagrams.
In this tutorial, we will instrument a Java Servlet application with interceptors and AspectJ. For other options to generate traces in Java and other programming languages, please consult the respective pages in How to perform Trace Analysis and How to apply Kieker in Java EE Environments.
We use the OperationExecutionRecord from the controlflow package
to collect trace information. There is also an alternative
flow-based set of monitoring events which can be used alternatively.
However, they are not used in this tutorial. More information on
monitoring traces can be found in tutorials-how-to-perform-trace-analysis.
The OperationExecutionRecord attributes operationName, tin,
and tout represent the full qualified name of the operation
including the class name, the time before execution of the operation and
the time after the execution, respectively (see JavaDoc
OperationExecutionRecord).
The attributes traceId and sessionId are used to store trace and
session information; eoi and ess contain control-flow
information needed to reconstruct traces from monitoring data. For
details please refer to the technical report and
JavaDoc.
Prerequisites
A basic understanding of how Kieker performs monitoring (see Getting Started)
Basic knowledge of AspectJ, i.e., that it is an aspect-oriented approach and technology
Basic knowledge what a Servlet application is
Docker, in case you want to use docker to run the example (optional)
Download the Servlet Engine Jetty (tested with 9.4.30)
Getting JPetStore
Checkout the JPetStore here and switch to the single-jpetstore branch, for a vanilla JPetStore. Please note: There is also a variant pre-configured with Kieker probes utilizing the flow events instead of the controlflow events used in this tutorial.
git clone https://github.com/research-iobserve/jpetstore-6.git

cd jpetstore-6
git checkout single-jpetstore
Now it is time to check whether your version compiles with
mvn compile package
This produces an output similar to
[INFO]
[INFO] --- maven-war-plugin:3.1.0:war (default-war) @ jpetstore ---
[INFO] Packaging webapp
[INFO] Assembling webapp [jpetstore] in [/home/user/jpetstore-6/target/jpetstore]
[INFO] Processing war project
[INFO] Copying webapp resources [/home/user/jpetstore-6/src/main/webapp]
[INFO] Webapp assembled in [97 msecs]
[INFO] Building war: /home/user/jpetstore-6/target/jpetstore.war
[INFO] ------------------------------------------------------------------------
[INFO] BUILD SUCCESS
[INFO] ------------------------------------------------------------------------
[INFO] Total time: 19.034 s
[INFO] Finished at: 2020-06-15T13:22:23+02:00
[INFO] ------------------------------------------------------------------------
The resulting war file is located in target inside the main project
directory jpetstore-6 and named jpetstore.war.
Instrumenting JPetStore
JPetStore is a small demonstration example of a Servlet based application. That means external HTTP requests to the application trigger a trace through the application. Therefore, we must instrument the incoming request and all subsequent method calls through the application. Thus, we must use Servlet interceptors and instrument all methods, which we can do with AspectJ.
Instrumenting Servlet Requests
The Java Servlet API includes the javax.servlet.Filter interface.
It can be used to implement interceptors for incoming HTTP requests.
Kieker provides a SessionAndTraceRegistrationFilter probe which
implements the javax.servlet.Filter interface. It initializes the
session and trace information for incoming requests. If desired, it
additionally creates an OperationExecutionRecord for each
invocation of the filter and passes it to the MonitoringController.
To integrate the interceptor into the application, you must add a filter
configuration to the web.xml file. The web.xml file is located in
jpetstore-6/src/main/webapp/WEB-INF
<filter>
   <filter−name>sessionAndTraceRegistrationFilter</filter−name>
   <filter−class>kieker.monitoring.probe.servlet.SessionAndTraceRegistrationFilter</filter−class>
   <init−param>
      <param−name>logFilterExecution</param−name>
      <param−value>true</param−value>
   </init−param>
</filter>
<filter−mapping>
   <filter−name>sessionAndTraceRegistrationFilter</filter−name>
   <url−pattern>/∗</url−pattern>
</filter−mapping>
In the above snippet, the Kieker class
kieker.monitoring.probe.servlet.SessionAndTraceRegistrationFilter
implementing the probe is registered in the Servlet application and the
filter-mapping assigns it to all Servlet URLs.
Instrumenting Method Calls
While the Servlet filter above will collect all HTTP requests to the application, it cannot collect the traces within the application. Therefore, we have to apply probes to all methods. In this tutorial, we use AspectJ and Kieker’s AspectJ probes to accomplish this goal.
Kieker includes the AspectJ-based monitoring
probes OperationExecutionAspectAnnotation, OperationExecu-tionAspectAnnotationServlet, OperationExecutionAspectFull,
and OperationExecutionAspectFullServlet which can be woven into
Java applications at compile time and load time. These probes monitor
method executions and corresponding trace and timing information. The
probes with the postfix Servlet additionally store a session
identifier within the OperationExecutionRecord. For this tutorial,
we use OperationExecutionAspectFull probe to collect trace
information.
To configure AspectJ, we have to create an aop.xml file and place it
src/main/resources within the jpetstore-6 project directory. It
contains the following lines:
<!DOCTYPE aspectj PUBLIC "−//AspectJ//DTD//EN" "http://www.aspectj.org/dtd/aspectj_1_5_0.dtd">
<aspectj>
        <weaver options="">
                <include within="org.mybatis..*"/>
        </weaver>
        <aspects>
                <aspect name="kieker.monitoring.probe.aspectj.operationExecution.OperationExecutionAspectFull"/>
        </aspects>
</aspectj>
Line 5 specifies which classes and methods within the project shall be
instrumented. The org.mybatis..* limits the instrumentation to
classes of the project itself and ignores all imported jar files, as we
are not interested to clutter the results with API internals. Line 9
selects the aspect OperationExecutionAspectFull. As indicated by
its name, this aspect makes sure that every method within the included
classes/packages will be instrumented and monitored.
Adding Dependencies
The JPetStore example uses Maven to build the application. Therefore, we
have now to adapt the build configuration to use AspectJ and Kieker.
Maven is configured by a pom.xml file located in the project root
directory.
Open the pom.xml in an editor. Here you must add
the dependencies for Kieker and AspectJ, and
the AspectJ compile time weaving.
In the dependency section of the pom.xml add:
<dependency>
        <groupId>net.kieker-monitoring</groupId>
        <artifactId>kieker</artifactId>
        <version>1.14</version>
</dependency>
<dependency>
        <groupId>org.aspectj</groupId>
        <artifactId>aspectjrt</artifactId>
        <version>1.8.7</version>
</dependency>
In the build section of the pom.xml add:
<plugin>
        <groupId>org.codehaus.mojo</groupId>
        <artifactId>aspectj-maven-plugin</artifactId>
        <version>1.8</version>
        <configuration>
                <source>1.7</source>
                <target>1.7</target>
                <complianceLevel>1.7</complianceLevel>
                <aspectLibraries>
                        <aspectLibrary>
                                <groupId>net.kieker-monitoring</groupId>
                                <artifactId>kieker</artifactId>
                        </aspectLibrary>
                </aspectLibraries>
                <xmlConfigured>${basedir}/src/main/resources/aop.xml</xmlConfigured>
                <sources>
                        <source>
                                <basedir>${basedir}/src/main/java</basedir>
                                <includes>
                                        <include>**/**.java</include>
                                </includes>
                        </source>
                </sources>
        </configuration>
        <executions>
                <execution>
                        <goals>
                                <goal>compile</goal>
                        </goals>
                </execution>
        </executions>
</plugin>
Please note that the src/main/resources/aop.xml is explicitly
specified in the configuration.
Configuring Kieker
The last step is to place a Kieker configuration file within the
application to instruct the MonitoringController where and how to
store the monitoring data. The kieker.monitoring.properties file
should contain the following information and must be placed in
src/main/resources/META-INF/ within the project directory.
## The name of the Kieker instance.
kieker.monitoring.name=KIEKER

## Whether a debug mode is activated.
kieker.monitoring.debug=false

## Enable monitoring after startup
kieker.monitoring.enabled=true

## The name of the VM running Kieker or empty (will automatically be resolved)
kieker.monitoring.hostname=

## Automatically add a metadata record
kieker.monitoring.metadata=true

## Enables the automatic assignment
kieker.monitoring.setLoggingTimestamp=true

## Register shutdown hook
kieker.monitoring.useShutdownHook=true

## Do not use JMX
kieker.monitoring.jmx=false

## The size of the thread pool used to execute registered periodic sensor jobs.
kieker.monitoring.periodicSensorsExecutorPoolSize=0

## Disable adaptive monitoring.
kieker.monitoring.adaptiveMonitoring.enabled=false

## Timer to use
kieker.monitoring.timer=kieker.monitoring.timer.SystemNanoTimer

## Report timestamps in
## Accepted values:
## 0 - nanoseconds
## 1 - microseconds
## 2 - milliseconds
## 3 - seconds
kieker.monitoring.timer.SystemMilliTimer.unit=0

## Writer configuration
kieker.monitoring.writer=kieker.monitoring.writer.filesystem.FileWriter

## output path
kieker.monitoring.writer.filesystem.FileWriter.customStoragePath=$LOGGING_DIR/
kieker.monitoring.writer.filesystem.FileWriter.charsetName=UTF-8

## Number of entries per file
kieker.monitoring.writer.filesystem.FileWriter.maxEntriesInFile=25000

## Limit of the log file size; -1 no limit
kieker.monitoring.writer.filesystem.FileWriter.maxLogSize=-1

## Limit number of log files; -1 no limit
kieker.monitoring.writer.filesystem.FileWriter.maxLogFiles=-1

## Map files are written as text files
kieker.monitoring.writer.filesystem.FileWriter.mapFileHandler=kieker.monitoring.writer.filesystem.TextMapFileHandler

## Flush map file after each record
kieker.monitoring.writer.filesystem.TextMapFileHandler.flush=true

## Do not compress the map file
kieker.monitoring.writer.filesystem.TextMapFileHandler.compression=kieker.monitoring.writer.compression.NoneCompressionFilter

## Log file pool handler
kieker.monitoring.writer.filesystem.FileWriter.logFilePoolHandler=kieker.monitoring.writer.filesystem.RotatingLogFilePoolHandler

## Text log for record data
kieker.monitoring.writer.filesystem.FileWriter.logStreamHandler=kieker.monitoring.writer.filesystem.TextLogStreamHandler

## Do not compress the log file
kieker.monitoring.writer.filesystem.TextLogStreamHandler.compression=kieker.monitoring.writer.compression.NoneCompressionFilter

## Flush log data after every record
kieker.monitoring.writer.filesystem.FileWriter.flush=true

## buffer size. The log buffer size must be big enough to hold the biggest record
kieker.monitoring.writer.filesystem.FileWriter.bufferSize=81920
Key for the writer configuration are two properties
kieker.monitoring.writer which selects the writer and
kieker.monitoring.writer.filesystem.FileWriter.customStoragePath
which specifies where the data shall be stored. In this tutorial, we use
the kieker.monitoring.writer.filesystem.FileWriter which can write
text and binary log files and even compress the output if necessary. If
no customStoragePath is specified, Kieker will write to /tmp on
Unix machines or to the respective system wide directory for temporary
files. In the above code snippet, we specified $LOGGING_DIR as location
for log files. Please choose an appropriate path within your system.
Build and Run
To build the example got to the project root directory and type:
mvn clean compile package
This will produce a jpetstore.war file located in the target
directory of the jpetstore-6 project.
To run the JPetStore:
Download Jetty in case you have not done this already.
Unpack Jetty next to the
jpetstore-6project directory, e.g.,
drwxr-xr-x 11 user example 4096 Jun 15 14:32 jetty-distribution-9.4.30.v20200611
drwxrwxr-x 7 user example 4096 Jun 15 13:22 jpetstore-6
Copy the
jpetstore.warto the jettywebappsdirectory
cp jpetstore-6/target/jpetstore.war jetty-distribution-9.4.30.v20200611/webapps
Switch to the Jetty directory and start the application
cd jetty-distribution-9.4.30.v20200611

java -jar start.jar
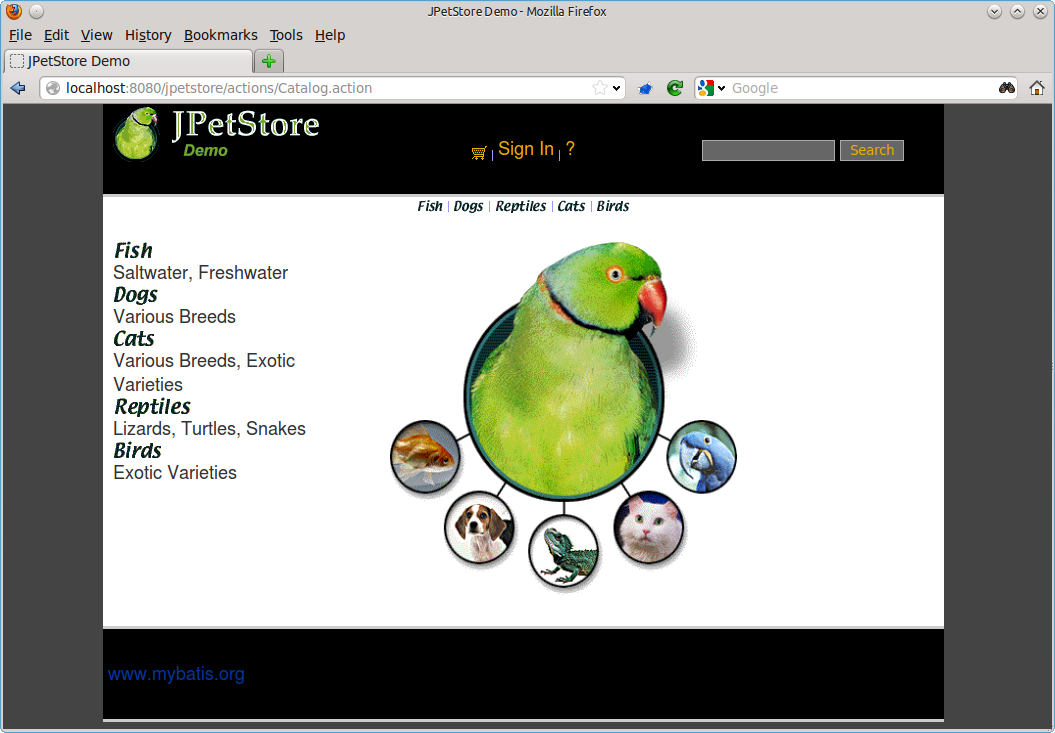
Now you can access the JPetStore from your browser with http://localhost:8080/jpetstore:
While you are using the application logging information appears in a newly created Kieker logging directory, e.g.,
kieker-20200615-130444-341575577055999-UTC--KIEKER/kieker-20200615-130444372-UTC-001.datkieker.map
Feel free to explore the whole JPetStore. While browsing through the shop, you will notice that the log files will grow over time.
Analyzing Traces
Monitoring data including trace information can be analyzed and visualized with the Kieker trace-analysis tool which is included in the Kieker binary distribution as well. A the tool outputs dot and pict files, tools to view such files are required. We usually use GraphViz and GnuPlot utils.
In order to use this tool, it is necessary to install two third-party pro-grams:
GraphViz A graph visualization software which can be down-loaded from
http://www.graphviz.orgGNU PlotUtils A set of tools for generating 2D plotgraphics which can be downloaded from
http://www.gnu.org/software/plotutils/(for Linux) and fromhttp://gnuwin32.sourceforge.net/packages/plotutils.htm(for Windows).ps2pdf The
ps2pdftool is used to convert ps files to pdf files.
Under Windows it is recommended to add the bin/ directories of
both tools to the “path” environment variable. It is also possible that
the GNU PlotUtils are unable to process sequence diagrams. In this case
it is recommended to use the Cygwin port of PlotUtils.
Once both programs have been installed, the Kieker
trace-analysis tool can be used. It can be found in the tools
directory of the Kieker binary release. Unpack the
trace-analysis-1.14.zip alongside the jpetstore-6 directory.
Start scripts can then be found in
trace-analysis-1.14/bin/trace-analysis (Unix) and
trace-analysis-1.14/bin/trace-analysis.bat (Windows).
Non-parameterized calls of the scripts print all possible options on the
screen.The commands shown in Listings below generate a sequence diagram
as well as a call tree to an existing directory named out/. The
monitoring data is assumed to be located in the logging directory, e.g.,
kieker-20200615-130444-341575577055999-UTC--KIEKER/ alongside the
jpetstore-6 directory.
Before executing the trace-analysis, you need to create the out/
directory alongside the jpetstore-6 directory.
Unix version
trace-analysis-1.14/bin/trace-analysis -inputdirs kieker-20200615-130444-341575577055999-UTC--KIEKER \
        -outputdirout/ \
        -plot-Deployment-Sequence-Diagrams–plot-Call-Trees–short-labels
Windows version
trace-analysis-1.14/bin/trace-analysis.bat -inputdirs kieker-20200615-130444-341575577055999-UTC--KIEKER
        -outputdir out\
        -plot-Deployment-Sequence-Diagrams–plot-Call-Trees–short-labels
The resulting contents of the out/ directory should be similar to
the following tree:
out/deploymentSequenceDiagram-6120391893596504065.piccallTree-6120391893596504065.dotsystem-entities.html
The .pic and .dot files can be converted into other formats,
such as .pdf, by using the GraphViz and Plot Utils
tools dot and pic2plot. Type the following to generate PDF
file from the graphics.
dot callTree−6120391893596504065.dot -T pdf -o callTree.pdf
pic2plot deploymentSequenceDiagram−6120391893596504065.pic-T pdf > sequenceDiagram.pdf
The scripts dotPic-fileConverter.sh and dotPic-fileConverter.bat convert
all .pic and .dot in a specified directory. The scripts can
be found in the bin directory of the Kieker binary distribution.